Saturday, November 7, 2009

Market Commentary:

The bad news today is that the unemployment number came in at 10.2%, the highest unemployment number officially released since early 1983 and significantly higher than expectations of 9.9%.

This headline number will continue to weigh on the market for a few days as the man in the street will hear it discussed on virtually every news channel over the weekend, suggesting that consumer sentiment will drop going forward. Expect to see a disappointing Michigan Consumer Sentiment number next week.

The good news was that the markets did not tank on this shocking jobs report. In fact, the lows of the day were set fairly early and after chopping around the unchanged mark for most of the day, some late day buying pushed most indexes into the black, though minor. Of the major indexes only the small caps finished in the red, and fairly minor at that. I guess we could say it was a “minors” day.

So what does this all mean?

Beyond the impact of the total unemployment percent was the monthly jobs number, coming in at a respectable -190,000 from -219,000 for the previous month. Job losses are getting smaller and smaller each month. At least it is going in the right direction.

There was other good news in this jobs report. Temporary employment increased by 34,000 jobs, the average work week held steady at 33 hours and the hourly earnings increased 0.3% versus 0.1% the previous month. These are all indications that companies have cut labor about as far as they can and are now using temporary services and increasing payroll earnings to meet their labor demands.

As these details are digested in the coming days, the shock of this number will likely wear off and the market should continue to advance – for a while. The daily indicators suggest that there is a little more upside before the markets reach short-term oversold conditions.

The longer term negative implication for today’s number is that the Fed has been put into an even tighter bind, perhaps exactly where they want to be. With total unemployment at these dizzying heights, the Fed will be hard pressed to show any evidence of support for a falling dollar by raising interest rates.

In fact, when you look at “real” unemployment, including those who have dropped off the unemployment benefits yet still cannot find jobs even though they are willing to work, the figure goes up to an official 17.5% with many analysts suggesting it could be in excess of 20% for actual unemployment.

Lost in the headlines of 10% unemployment was an important vote taken late yesterday on a bill to extend unemployment benefits by 14 weeks. We will probably hear the administration tout this over the next few days as the bill makes its way to Obama’s desk for signing.

Tacked on to this bill were provisions for extending the $8,000 first-time homebuyer credit with a twist allowing a $6,500 credit for refinancing of homes where the owner has lived in the home for at least five years. I told you they would keep us sucking on the bottle as things appear to worsen. Will this bring even more future demand forward, pushing out the inevitable day when no more incentives exist to encourage additional spending? I expect more gravy like this before the year ends.

Let’s return to the impact of today’s jobs report on the dollar and the bind the Fed has worked into. Perhaps the Fed is pleased to be in this condition of having their hands tied to keeping interest rates near zero, the thinking being that as the dollar is continuously devalued effective labor rates in the US compared to overseas will cause jobs to return to US shores.

There are all kinds of problems with this kind of thinking. Remember what happened when interest rates were kept artificially low in the 2003-2007 period? It fed the horrible real estate and securitized mortgage bubbles, which inevitably led to the 2007-2009 bear market as credit collapsed amid banking exposure to highly leveraged mortgage securities for properties that were collapsing in value.

Do you think that a return to extended periods of low interest rates (which will further collapse the dollar) will do anything more than create another investment bubble somewhere else?

It is folly to fall into the simplistic trap of thinking that we can create a large new labor market by collapsing the dollar. Today’s investors want a real return on their money, with little consideration on whether that investment creates jobs or not.

Where do you think capital is going to move if the dollar continues to drastically decline in value? Do you really think that investors are going to plunk down money to invest in plants and equipment when their dollar investment is going to lose great value, simply based on the currency exchange rate? That dollar can go other places, you know.

Do you really think that large financial institutions are going to be motivated to borrow money at near zero percent and then loan it out for buildings and equipment at anywhere near reasonable rates when they can take those dollars and simply place them in other investments where they can make a greater return?

Banks have made so much money by borrowing at zero interest and then leveraging it in the stock market and similar investments that there is little to no incentive for them to go back to their original charter of being a lender. They are in the business of making money and they can make more if they invest it in the next bubble (rising stocks and securities) rather than risk that money on a mortgage for a piece of risky valued property and/or equipment.

In reality, a continual decline in the dollar just makes it more expensive for the American consumer to get by. Much of what we purchase in the US is manufactured outside of our country. As the dollar is devalued, these things will become more expensive – hence, inflation … perhaps terrible inflation.

While the intent may be to create a disincentive for consumers to purchase imported goods and motivate them to purchase US manufactured goods so that more jobs can be created to produce US manufactured goods, it is just not that simple.

Capital will flee the US on a permanently devalued dollar, removing the very thing needed to create US manufacturing capacity. Thus, jobs will suffer rather than increase because of the persistent belief that a lower dollar benefits jobs, exports, and contributes to an affinity for US produced goods. It won’t happen.

The Fed’s persistence in driving the dollar lower on the supposed belief that it is good for the US economy will do nothing than what it has done in the past. It will create another bubble that the quick and informed financial wizards can profit from – to the demise of our economy and the purchasing power of the average US citizen.

But isn’t this what the Fed is all about?

Even the most uninformed among us can surely see that this action is benefiting the banks the most, with very little of our government bailout/stimulus going to the benefit of the consumer, either by way of jobs or tax benefits.

The message you hear is that a near zero interest rate benefits the consumer by keeping lending rates low. In actuality, a near zero interest rate closes down the lending machine and diverts the needed capital into a bubble opportunity for the speculative financial captains of our US economy.

It’s all about them, not about you.

Check it out here:

While there is still evidence from a technical basis that the short-term cycle has potential for further advance, the risk of a bearish pattern setting up for the longer term remains. Check out the potential development of the current bearish head and shoulders pattern:

As you can see, the market needs to advance a lot to best the October highs. While this remains a possibility, there is a clear risk that this rally could fall short and develop a lower high with the next decline testing the neckline of this pattern (the black dashed line).

Should the neckline be violated on a coming decline (after this advance finishes up) then the traditional expectation is that a stronger intermediate term correction could develop, taking prices generally 40-60% down from the highs seen in October.

We continue to watch and maintain a cautiously bullish bias, acknowledging the risk that a larger correction may be underway as well.

Friday, November 6, 2009

Trade the Gold Silver ratio

Hi Fellow Trader,

The United States has had 243 foreign military interventions since Thomas Jefferson.

The man who predicted the fall of the Soviet Union in 1980, now says the US Empire will fall by 2020. And, America will then be great again. You see, American hasn't even begun. It has been under the shackles of international bankers since 1913. People pay money to loans from money created out of nothing to international banking cartels all under the name of price stability.

Think of all the resources that go to overseas wars, and it's no wonder. With all of those resources staying in the country (ok not all but a lot more resources) then the US can rebuild.

It's so incredibly ironic to get news from Russia Today, an all English channel on YouTube. I often find some good stories there you'll never get on CNN. http://www.youtube.com/user/RussiaToday


http://www.youtube.com/watch?v=SfcoNlhxRow&feature=player_embedded

Trends go further and last longer than anyone thinks possible.

There are only so many times that Lucy can tell Charlie Brown she'll hold the football.

There are five steps to change:

1. You walk down the street and you fall in a hole. You are upset about the hole in the street. You climb out and continue walking.
2. You walk down the same street and fall in the same hole. You think, "I can't believe I fell in the same hole again. This is ridiculous." You climb out of the hole.
3. You walk down the street and you fall in the same hole again. Now you're furious that the hole is still there. You again, climb out.
4. You walk down the street and walk around the hole.
5. You walk down another street.

Not all revolutions are violent. Like Tolstoy, author of "War and Peace" said, "There can only be one permanent revolution. The regeneration of the inner man".

That's when you walk down another street.

Gold, and the Markets

Not all trends go nicely upward. Often, they can go in bursts. Gold (GLD) continues to move higher. If you want a real store of wealth buy silver coins, since they are trading well below their gold to silver ratio in the Earth's crust, which is 17:1. So, silver should be about $65 an ounce. It's $17. Discount? Yes. Or, gold should be $289.00. Either way. If they meet in the middle, then silver would rise. So, I think silver is the better bet. Also, a one ounce silver coin is much better for doing business, like paying the neighbor's kid to mow your lawn with. This used to be five bucks didn't it?

Good Trading,

WALL STREET ROULETTE

Market Commentary:

Whether you want to point to a sharp drop in the weekly jobless claim benefits or if you prefer to believe like me that in deeply oversold short term conditions stocks shot sharply higher today, with the DOW pushing back over 10,000 again.

Today the Labor Department reported that unemployment benefits fell sharply for the week down to 512,000. That would be the lowest level since last January.

In any case, the stock market saw this as a good omen that perhaps tomorrow’s consistently distorted jobs report, might also be distorted favorably again.

I am crossing my fingers that the fact that the stock market closed at the highs for the day might suggest a pick up in employment ahead of the holiday season.

Economists are hoping for a drop to -175,000 jobs lost, which would be an improvement from -263,000 jobs lost in the previous month. The unemployment rate is expected to rise to 9.9%.

Meanwhile---

It was announced today:

Fannie Mae (FNM/NYSE) reported a net loss of $18.9 billion in the third quarter of 2009, compared with a loss of $14.8 billion in the second quarter of 2009. Third-quarter results were largely due to $22.0 billion of credit-related expenses, reflecting the continued build of the company’s combined loss reserves and fair value losses associated with the increasing number of loans that were acquired from mortgage-backed securities trusts in order to pursue loan modifications.

But there is hope---

As a result, on November 4, 2009, the Acting Director of the Federal Housing Finance Agency (FHFA) submitted a request for $15.0 billion from Treasury on the company’s behalf. FHFA has requested that Treasury provide the funds on or prior to December 31, 2009.

Fannie Mae announced a new program Thursday that will allow some homeowners facing foreclosure to hand the deed back to their lender but remain in the home as a renter.

The idea behind their new "Deed for Lease Program" is that allowing rent-backs will minimize family displacement and stanch the deterioration of neighborhoods plagued by vacant foreclosures, according to Fannie's announcement.

http://voices.washingtonpost.com/local-address/2009/11/fannie_mae_allowing_some_troub.html

Sounds great doesn’t it?

Oh the other big benefit is that Fannie Mae will not have to declare the foreclosure losses on their balance sheets each quarter.

A STEP TOWARDS SOCIALISM

What we really have here is a planned government guaranteed security program at the expense of our liberties as people hand over their deeds to the very government that caused them to lose their homes in the first place.

At least you get to stay and rent for one year while the government provides you food stamps and 20 more weeks for your unemployment benefits, while they spend us into poverty.

I am sorry but must I remind readers that poverty is a form of bondage. Fannie Mae will not have to report how many people are falling into default status and given the fact that the government now owns Fannie Mae, any attempt to hide how many people are losing their homes is just another form of deceit, that each of us as citizens should object to.

I object to the government remaining mute on the fact that oil prices are creeping up to $80 when they know that more and more people will default on their homes and fall into financial bondage to the government.

The industrial achievements of the U. S. are the result of an economic system which is the antithesis of socialism. Our economic system is called 'capitalism' or 'private enterprise' and is based on private property rights, the profit motive and competition.

Sending crude oil prices up again to $14o a barrel will crash the economy. What does that do to private property rights? It trashes them.

We have to wake up people and I think some people are waking up all across the country.

Our country is stepping towards socialism. What is socialism? It is simply governmental ownership and management of the essential means for the production and distribution of goods. We must never forget that nations may sow the seeds of their own destruction while enjoying unprecedented prosperity.

When the press and other propaganda media sources are constantly selling the principles of centralized or federal control of homes, farms, railroads, energy, electric power, schools, steel, maritime shipping, and many other aspects of the economy--but always in the name of public welfare, liberty is being challenged by such creeping socialism.

We need a free economy, a free stock market on the basis of free enterprise. We need to get back to our roots.

Please understand. I don’t mean to pick on any political party but we need to think deeply about where our country is heading here.

EXPENSIVE OR DOES IT MATTER ANY MORE?

With nearly all of the corporate earnings now accounted in the S&P 500 for the third quarter, you might be interested what the facts are straight from Standard and Poor’s.

You can review these numbers by clicking here:

S&P 500 Statistics
As of October 30, 2009

Total Market Value ($ Billion) 9,124
Mean Market Value ($ Million) 18,248
Median Market Value ($ Million) 7,635
Weighted Ave. Market Value ($ Million) 75,767
Largest Cos. Market Value ($ Million) 344,431
Smallest Cos. Market Value ($ Million) 642
Median Share Price ($) 31.800
P/E Ratio* 137.98
Indicated Dividend Yield (%) 2.09


*Based on As Reported Earnings.

Check out the Standard and Poor’s computation of what they think their P/E ratio is for the 500 stocks in their index. At 137.98 times earnings, which allows for the removal of the “mark to the market” accounting rule change, giving banks the ability to value their bad debt at whatever value banks what to value them at, we still have the most expensive market of all time.

The previous highest P/E ratio in history for the S&P 500 was 46 times earnings.

Rather sobering isn’t it?

Is this a free stock market? I think not!

Technical outlook


Friday's economic calendar:
4:00 G20 St. Andrews, Day 1
8:15 Community Bankers Symposium
8:30 Nonfarm payrolls
9:30 Hearing: Employment Situation
10:00 Wholesale Trade
10:00 Briefing: Unemployment data and economic recovery
3:00 PM Consumer Credit

Wow! You can’t make up this much two-way action except with a roulette wheel. For the tourists, Da Boyz got the DJIA back to 10,000 but volume was again relatively light which is mystifying. Once again shorts are squeezed and this two-way action is difficult for most investors to either trade or comprehend. The action today was based on “better than expected” lousy numbers from CSCO and lower Jobless Claims (which, by the way, are still high).

The employment number tomorrow is more important and should further encourage bulls or bears. The interesting story in this post is what’s going on with UUP which is highlighted below within Uncle Buck’s section.

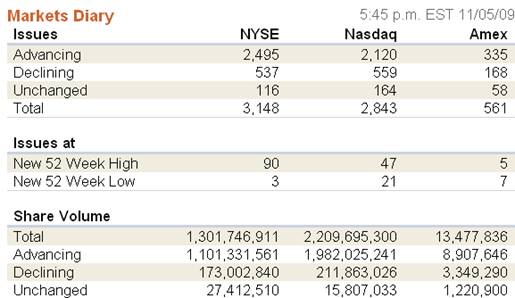
Volume was below recent levels while breadth was excellent.

click to enlarge


S&P Trend Support Resistance
Weekly Up 876 1200
Daily down 1012 1110
Vix Bullish 20
24.50
R3 1081
R2 1064
R1 1053
Pivot 1047
S1 1036
S2 1030
S3 1013
NOTE:

Oil
Trend Support Resistance
Weekly
Up 65.00 90.00
Daily Up 65.00 90.00
Note:

Euro Trend Support Resistance
Weekly UP 1.4304 1.5066
Daily Down 1.4440 1.5006
R3 1.5074
R2 1.4946
R1 1.4835
Pivot 1.4707
S1 1.4596
S2 1.4468
S3 1.4357

S&P500

- Long term trend remains up, and intermediate trend is now Up

- So I completely got yesterday wrong when writing my comments. No one is perfect, so lets just get up from where we fail down. Yesterday's bullish price action pushed the intermediate trend indicator back up. Now we have all short, intermediate and long term trend pointing higher.

NYSE McClellan oscillator is now well out of oversold and we should see this indicator go back to overbought. Market should continue to move higher until another overbought condition arrives.

I think the market will sell off today after the job numbers, as too much bullishness with yesterday's advance. But that does not mean the market is turning lower. With the up trend intact, instead, I will be looking to buy into this sell off.

Crude Oil

- Long term trend remain up , intermediate trend turned up.

- Nothing new with oil, should continue to move higher. But there seems to be a lot of back and forth action around the $80 level. I am not planning on taking this oil trade as there are better opportunities trading gold and silver at this point in time in the commodity market.

Gold

- Long trend remains up while intermediate trend is Up

- nothing new to say about gold, should see price consolidate Friday before another leg up next week. Traders that missed our entry point could enter at a break out point to new highs.

US Dollar

- Long term trend remains down, intermediate trend is now down
- Dollar continues to drift lower as I've indicated. I hold my guidance of $75 by next week.
Below is a press release in part from DB Commodity Services regarding a filing to issue more shares in UUP.

“DB COMMODITY SERVICES FILES WITH THE SEC TO REGISTER 100 MILLION ADDITIONAL SHARES OF POWERSHARES DB US DOLLAR INDEX BULLISH FUND

NEW YORK, November 5, 2009 ­ DB Commodity Services LLC today announced it has filed a registration statement with the US Securities and Exchange Commission (SEC) to register 100,000,000 additional shares of PowerShares DB US Dollar Index Bullish Fund (NYSE Arca: UUP) in order to meet investor demand. Creations of new shares in the fund are temporarily suspended pending clearance of the registration statement by the SEC, the Financial Industry Regulatory Authority and the National Futures Association and declaration of the effectiveness of the registration statement.

Additional information is contained in two related 8K filings which are available at: www.sec.gov. DB Commodity Services LLC.”

Below is the explanation of this activity courtesy of Scott Larison of Forefront Advisory Services:

“The demand for UUP NOV. 23 calls the past week may be related to a Hedge Fund taking a shot on the Dollar bottoming out. Open interest in these calls has skyrocketed the past week and is registering nearly 300k contracts or nearly $30 million in underlying value. As customers buy these calls, market makers who sell them must buy stock to hedge these call sales. Here is the past 10 day volume of the calls vs puts, and the open interest of the calls and puts. AVGATM VOL = Average at the money implied vol of the front mo options- notice the spike.”


Date Calls Puts CallOI PutOI AvgAtmIV Close
10/22 8631 563 274k 36k 13.6% 22.31
10/23 19k 488 280k 37k 11.4% 22.43
10/26 69k 4352 295k 37k 14.1% 22.58
10/27 65k 863 352k 41k 13.2% 22.64
10/28 183k 2879 393k 41k 13.7% 22.73
10/29 28k 3249 552k 43k 12.5% 22.57
10/30 46k 2644 566k 45k 13.3% 22.70
11/2 44k 160 596k 46k 17.4% 22.62
11/3 45k 322 621k 46k 14.0% 22.68
11/4 403k 2822 630k 46k 15.4% 22.51

Should these bets pay-off for the speculator(s) it would be a negative for gold and other commodities as well. But, somebody has wind of something to cause the dollar to rally whether it’s from central bank interventions or a policy change or….? Certainly, not all hedge funds are perfectly smart but, as we’ve seen lately, they’re better “informed”.

The market has lost its dominant trend the past month, substituting lots of action but no real progress. That will change eventually but no one likes trading range markets. Just when you think markets are starting in one direction we reverse course. Clearly, after a 50-60% gain from March lows, consolidation is not unexpected. I’d be most careful of January since bulls may prop things up artificially through the holidays.

Most interesting today is what’s going on with UUP. Who is making these big bets? What information do they have we don’t? We’ll find out eventually but if these speculative positions pay off for them, it could upset a lot of positions particularly in commodities and perhaps Emerging Markets as well.


--
Michael Chang
Technical Analyst
Washington Asset Advisors

Tuesday, November 3, 2009

Market to rally in to FOMC

Market Commentary:

Stocks pulled off their lows at support levels as buyers returned to the market.
As I said yesterday given the extreme short term oversold market conditions and primary support levels for some of the indexes, I expected to see some sort of a right shoulder bounce to begin and today we began to see the market try and climb out of the hole.

The focus is on the FOMC meeting and no one is expecting the Fed do anything with interest rates. For one, how can the Fed raise rates given its extraordinary debt load and deteriorating tax base? This is a reality.

Consequently, the Fed is stuck and gold buyers are scrambling to take advantage of the situation. Gold jumped $30.90 to set a new all time high at $1,084.30 an ounce. Investors are confident the Fed will not raise interest rates and so are anticipating another collapse in the dollar.

Today, crude oil prices also surged, jumping $1.47 a barrel to close at $79.60. With the daily stochastics for crude oil at %K 9 and %D at 13, it suggests oil prices are about to take another surge again if the dollar slides.

I want to point out to investors this is also a danger to gold investors because crude oil prices soaring to $90 to $100 a barrel is the equivalent of the same drain on the economy as if interest rates were raising---it will ultimately collapse the economy and when that happens, commodities will begin to crash as we saw in 2008.

Given what is beginning to look like a broad market topping pattern developing in the stock market, when it becomes all too obvious that a new bear market is beginning, the bull market in gold will end and the dollar will begin to advance. But the bubble is still in the works, at least for a while longer, as long as the Fed can hold up the stock market.

I know gold is making new highs and everyone is bullish on gold, but just remember when the stock market crashes, so will gold. In a commodity driven stock market, gold and the stock market move in tandem and opposite the direction of the dollar.

As you can see from this weekly chart, gold is in a strong surge. But notice that the RSI values are at nearly 71% and the weekly stochastics are near 90%. If the RSI gets over 75, gold stocks are likely to react rather severely on the next correction, so watch your back.

TECHNICALS

As expected with deeply oversold short term conditions the market is attempting to nest. Today, the Russell 2000 index daily stochastics turn positive as the Russell 2000 finished up 1.4%.

As both of these charts show a short term bounce is trying to form here. But I would view any short term rallies as just that—short term and unlikely to endure given the overall market weakness and risk aversion that is growing.

Market breadth indicators are very weak and until they strengthen back into bull market territory the market has to be viewed now with the same perspective as we viewed the stock market back in 2007 when breadth began to break down.

We could turn things around and rally in the last few weeks of the year if the Fed will’s it so, but it looks as though they have their hands full with a rapidly deteriorating commercial real estate market. Even one of the Fed governors recently raised the alarm last week in a very unusual breach of Fed speak.

Consequently, we are looking to sell into any rally if technical weakness persists.

Technical Outlook

S&P Trend Support Resistance
Weekly Up 876 1200
Daily down 1012 1110
Vix Bullish 20
24.50
R3 1077
R2 1058
R1 1051
Pivot 1039
S1 1032
S2 1019
S3 1000
NOTE:

Oil
Trend Support Resistance
Weekly
Up 65.00 90.00
Daily Down
65.00 90.00
Note:

Euro Trend Support Resistance
Weekly UP 1.4304 1.5066
Daily Down 1.4440 1.5006
R3 1.5074
R2 1.4946
R1 1.4835
Pivot 1.4707
S1 1.4596
S2 1.4468
S3 1.4357

S&P500

- Long term trend remains up while intermediate trend remains down

- Yesterday's early gap down was met by dip buyers bring market back in to positive territory. NYSE McClellan Oscillator jumped back above oversold signaling short term higher price movements in the coming days. We are likely to see Fed keep rate steady today which should give the market some fuel to rally higher. This coming rally should last only a few days as the market is forming a head and shoulder pattern. With the right shoulder being formed in the process with resistance at 1070-1080. Long term trend for the S&P remains up, but the Russell and the Nasdaq have broken down below the Sept. low. This calls for more weakness for the month of Nov.

Crude Oil

- Long term trend remain up but intermediate trend remains down.

- Oil daily chart has formed a flag pattern. momentum is starting to move higher, this is setting up as a bullish pattern for oil price in the short term.

Gold

- Long trend remains up while intermediate trend is Up

- A few days ago I wrote about the technical pattern in gold is indicating the chance it would break away from the general market and move higher. Now the old resistance of 1070 now becomes support. The measured target to the upside is around the 1150, and then 1300 for the head and should pattern.

US Dollar

- Long term trend remains down, while intermediate trend is up
- Dollar broke through the $77 yesterday hitting my initial target but failed to close above that as gold rallied hard the day before FOMC. It seems like the market is expecting the Fed to keep rate steady and continue with its QE. This will be fundamentally bearish for the dollar. Technically, momentum also started to turn down yesterday. First target to the down side is $76.


--
Michael Chang
Technical Analyst
Washington Asset Advisors

Perception IS Reality

Here are some headlines from today:

- Oil hovers near $78 amid positive US economic data

- Asia markets fall as US recovery doubts linger

- Volatility returns to markets, pulls Dow off highs

A bit misleading if you read them all together. The writers of these articles can be typically out of school, need a job, and have to write about something. You can't really blame them I guess. When something happens in the marketplace, they always have to have a reason. I remember a few years ago when "market up because of surge in oil" and then, "heavy oil prices weigh on stocks". Or something to those effects. Obviously, the writers have to write about something.

So, be careful when reading headlines since you can't trade off of them, not really. There can be big themes, and you can keep those themes in mind. Also, the perception can become reality.

Perception IS Reality

In trading, you can trade on perception, but have the real reality in your mind, waiting for the opportunity of the real reality. Often, you can trade the perception, which is what we did when we shorted stocks to the very last day I believe (maybe we were a few days off... I can't remember) earlier this year.

The same was for internet stocks. Perception was reality when internet stocks were booming. The real reality was that it was ridiculous. But why trade the real reality? You have to wait until the technicals match up with the real reality, and then you can really have some great trades.

Good Trading,

Monday, November 2, 2009

No Recovery. Cover Up

Hi Fellow Trader,

Friday took back all of Thursday's gains. This would be fairly normal if Thursday's rally wasn't the first snapback in a negative trend. There are different types of trends. There is the major trendline, which would be more of a monthly chart, looking at one month at a time, and there are weekly charts, and daily. For now, the daily looks very bad, and the weekly is looking to start to look quite bad.

Questioning Authority

Here is a great article on questioning unconstitutional authority: http://tinyurl.com/yl3pfy2

No Recovery. Cover Up

Here's what Gerald Celente says: http://tinyurl.com/yhjw8da

It could be that the Us will be left behind in the world economy.

We'll see what happens. We'll trade based on the charts, and get the story as we go. However, we have to trade based on the expectations as to whether things are batter or worse than expected. That's how we trade. So, trading stocks isn't always trading the economy. If you try to trade the economy, you'll go bankrupt.

Commercial Real Estate

Stocks follow the market overall. When the market goes up you want the best sectors to outperform the market, and when the market goes down, you want the worst stocks to "outperform" the market and fall faster. Now I think it's commercial real estate.

Loans

The entire economy is based on lines of credits and loans. You probably don't know, but AIG's bailout wasn't an AIG bailout. Most of that money went to lines of credit with major banks who weren't going to get their money back since they weren't smart enough to analyze AIG's balance sheets correctly. It was, actually, a bailout for banks who made lousy decisions.

So now, what's going to happen when people don't want loans? They want to buy less? Then banks will make less money (on interest payments even though the interest itself is never created, so you have to pay from other loans). Here is the financial index: http://www.proshares.com/funds/skf_index.html

Technicals

If we have a rally for a day or two, it's not going to bother me. I think that things are starting to look quite bad. The risk is very high at the moment. If I look at SDS, it had three failed breakout attempts from the bottom since August. Now, it's trying to breakout again. I want to monitor this to see if it will follow through. If so, we might not only go short with SDS, but other select stocks. For now, I won't want to get overly excited to the bearish side. We should never be overly excited about anything, really. We trade.

Good Trading

Friday, October 30, 2009

Intraday update


Sorry for the late intra-day update, I have a meeting early morning so I am taking off early today.
I do think we are going to make fresh lows today and bounce up once the lower trend line is hit on the DOW